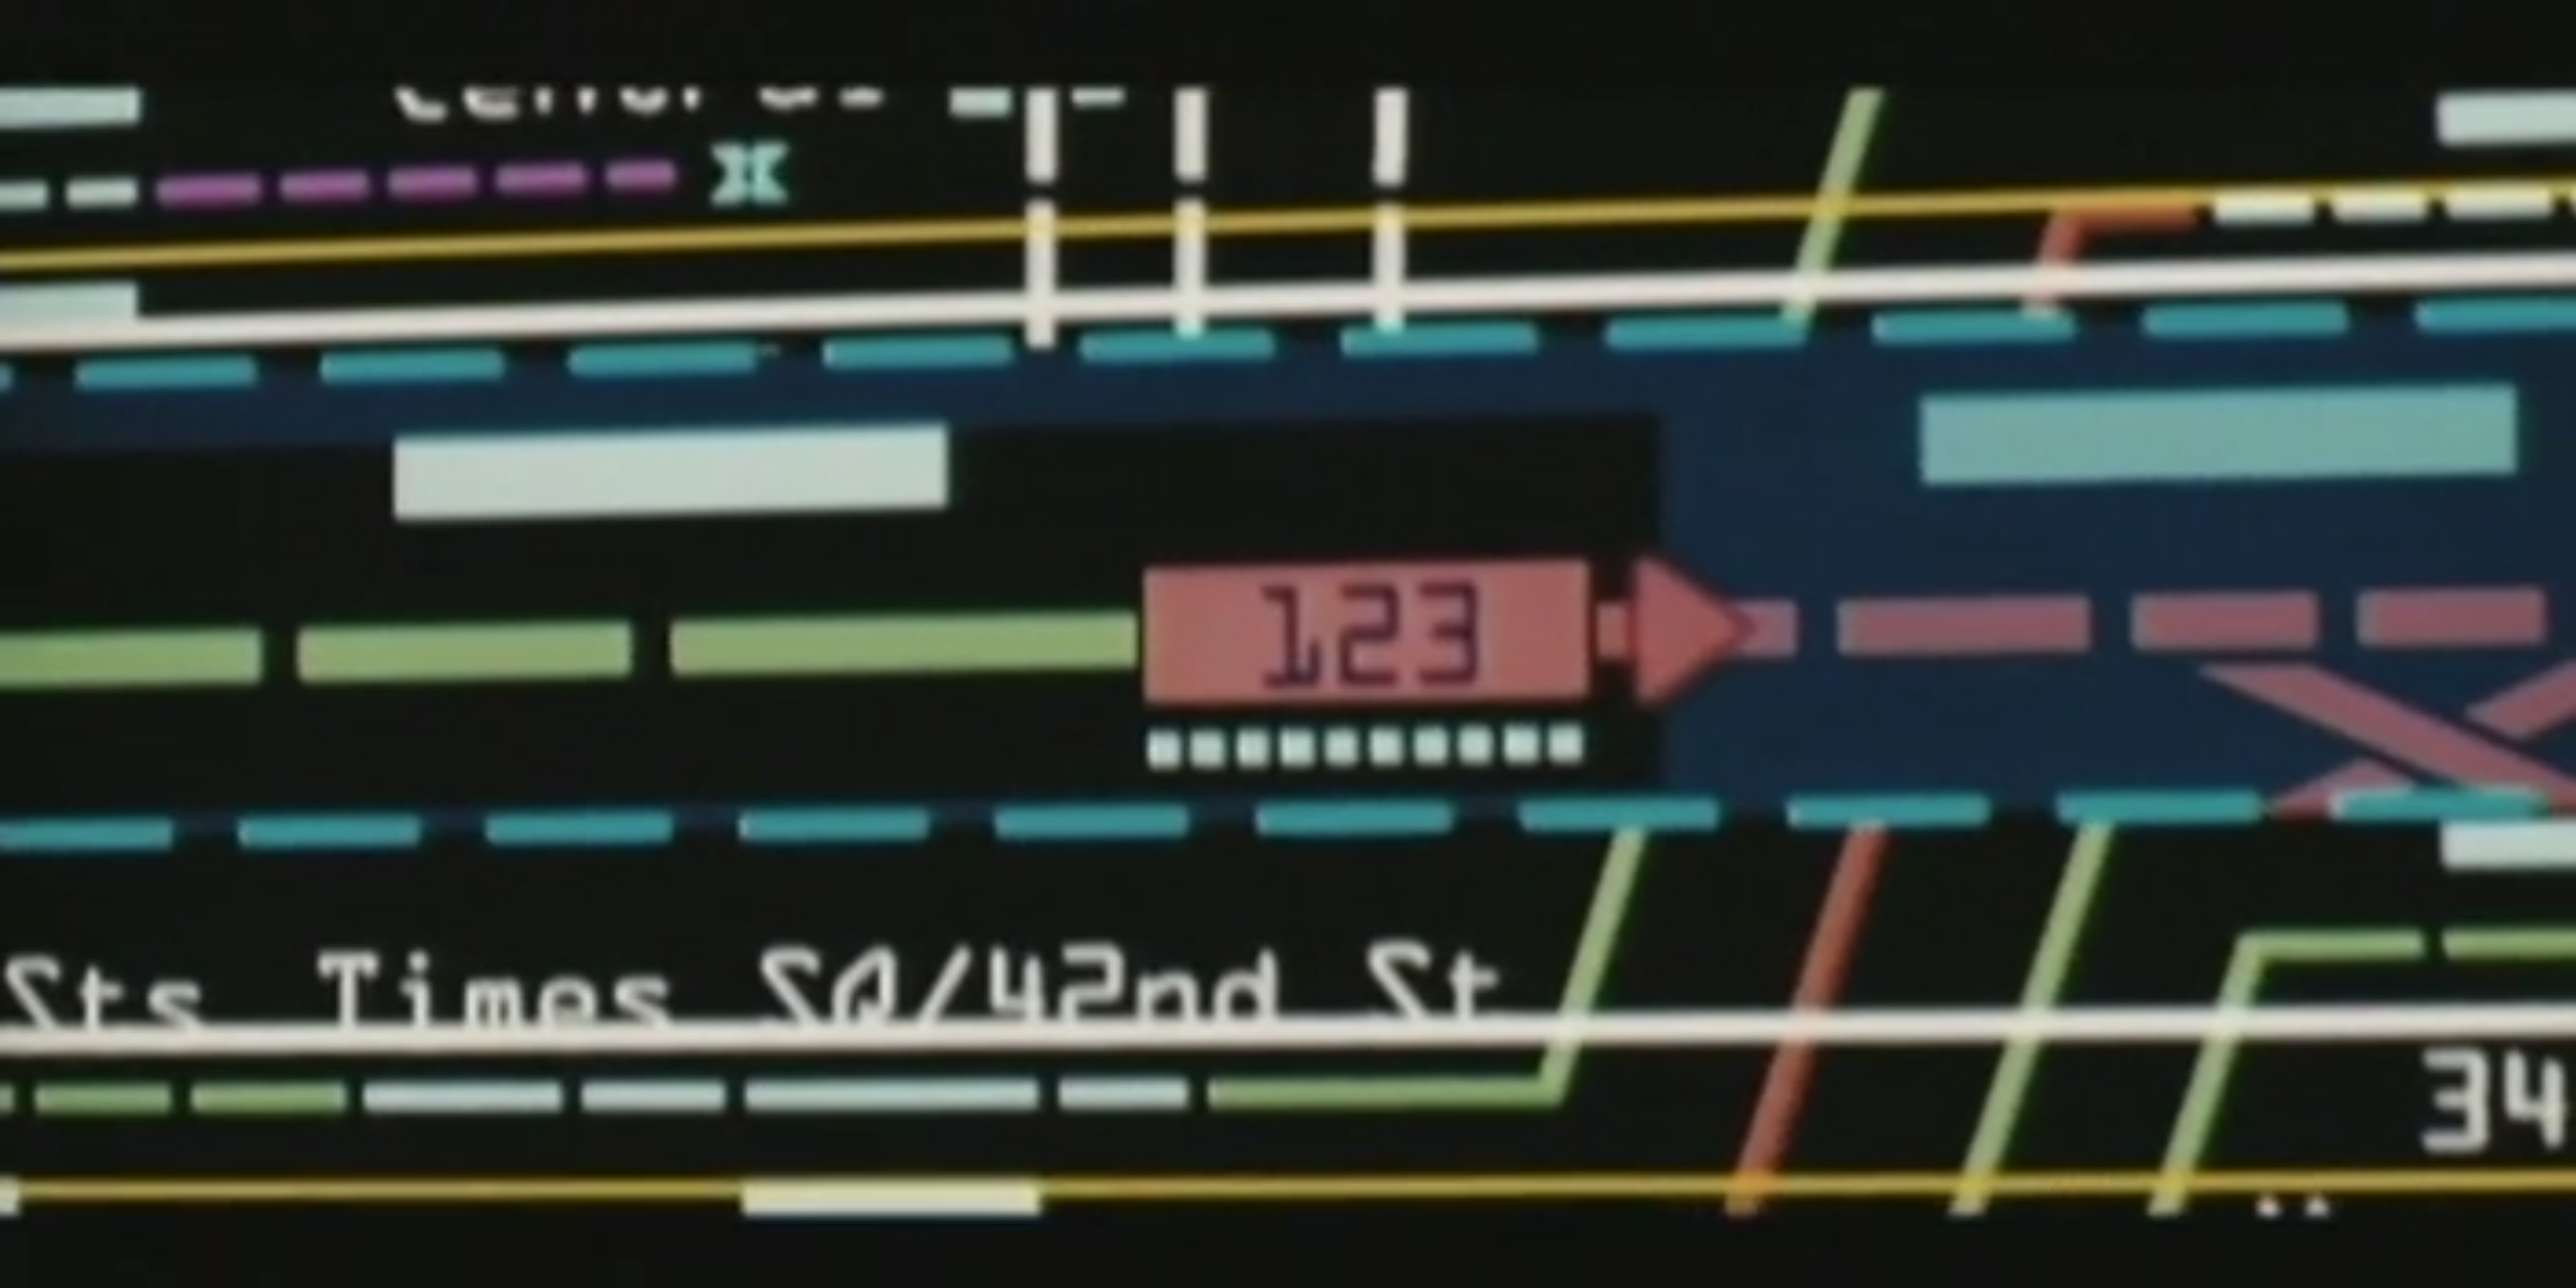
How many of us, whether film enthusiasts or simply curious, have imagined ourselves in those railway or metro traffic control rooms—like in The Taking of Pelham 123 with Denzel Washington and John Travolta—watching the enormous synoptic panels that show the exact position and status of every train? This complexity raises the question: how is an extensive railway network actually monitored and managed in real time with such precision? It is precisely this fascinating interconnection between railway operations and information technology that we are going to talk about. What we see in films is dramatized, but the principle of tracking and communication is real, supported by robust systems that ensure the safety and smooth flow of millions of journeys every day.
This article explores the key pain points encountered when using railML structures to build live synoptics. So, here we go—let’s talk about how this works in the real world.
1. What is railML
Live synoptics are graphical representations of railway infrastructure enriched with real-time operational data such as signal aspects, train positions, and route states. They are essential tools for traffic controllers, maintenance teams, and operators.
RailML, as an open and standardized railway data exchange format, used in the major railways all over the word, is often chosen as the foundation for building these synoptics. However, the core purpose of railML is data interoperability, not real-time visualization.
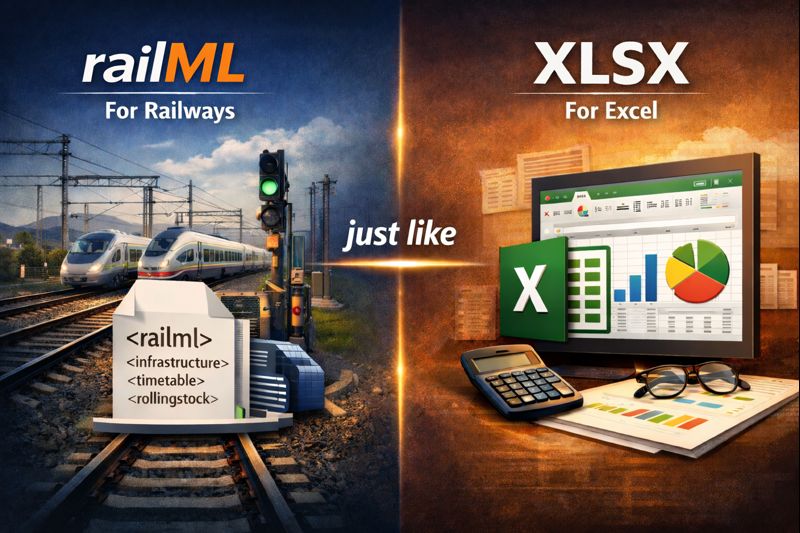
An easy way to explain railML is railML stands for railways like XLSX stands for Spreadsheets (Excel), is a universal format for transportation.
2. RailML Structure for Synoptics
Created in 2002, when companies and railway experts identified a common problem: each system used its own data format, which made integration difficult.
The solution was to define a common, open, and flexible format that could be used across the sector.
RailML, currently maintained by railML.org e.V., a non-profit association, provides a rich XML-based model for describing railway infrastructure, signalling, and operational concepts. Synoptic systems typically rely on the Infrastructure and Signalling subschemas to represent tracks, switches, signals, routes, etc.
While railML accurately captures logical and topological relationships, it lacks explicit information about graphical layout, symbol placement, and visualization rules. As a result, significant interpretation and transformation are required before the data can be rendered as a usable synoptic.
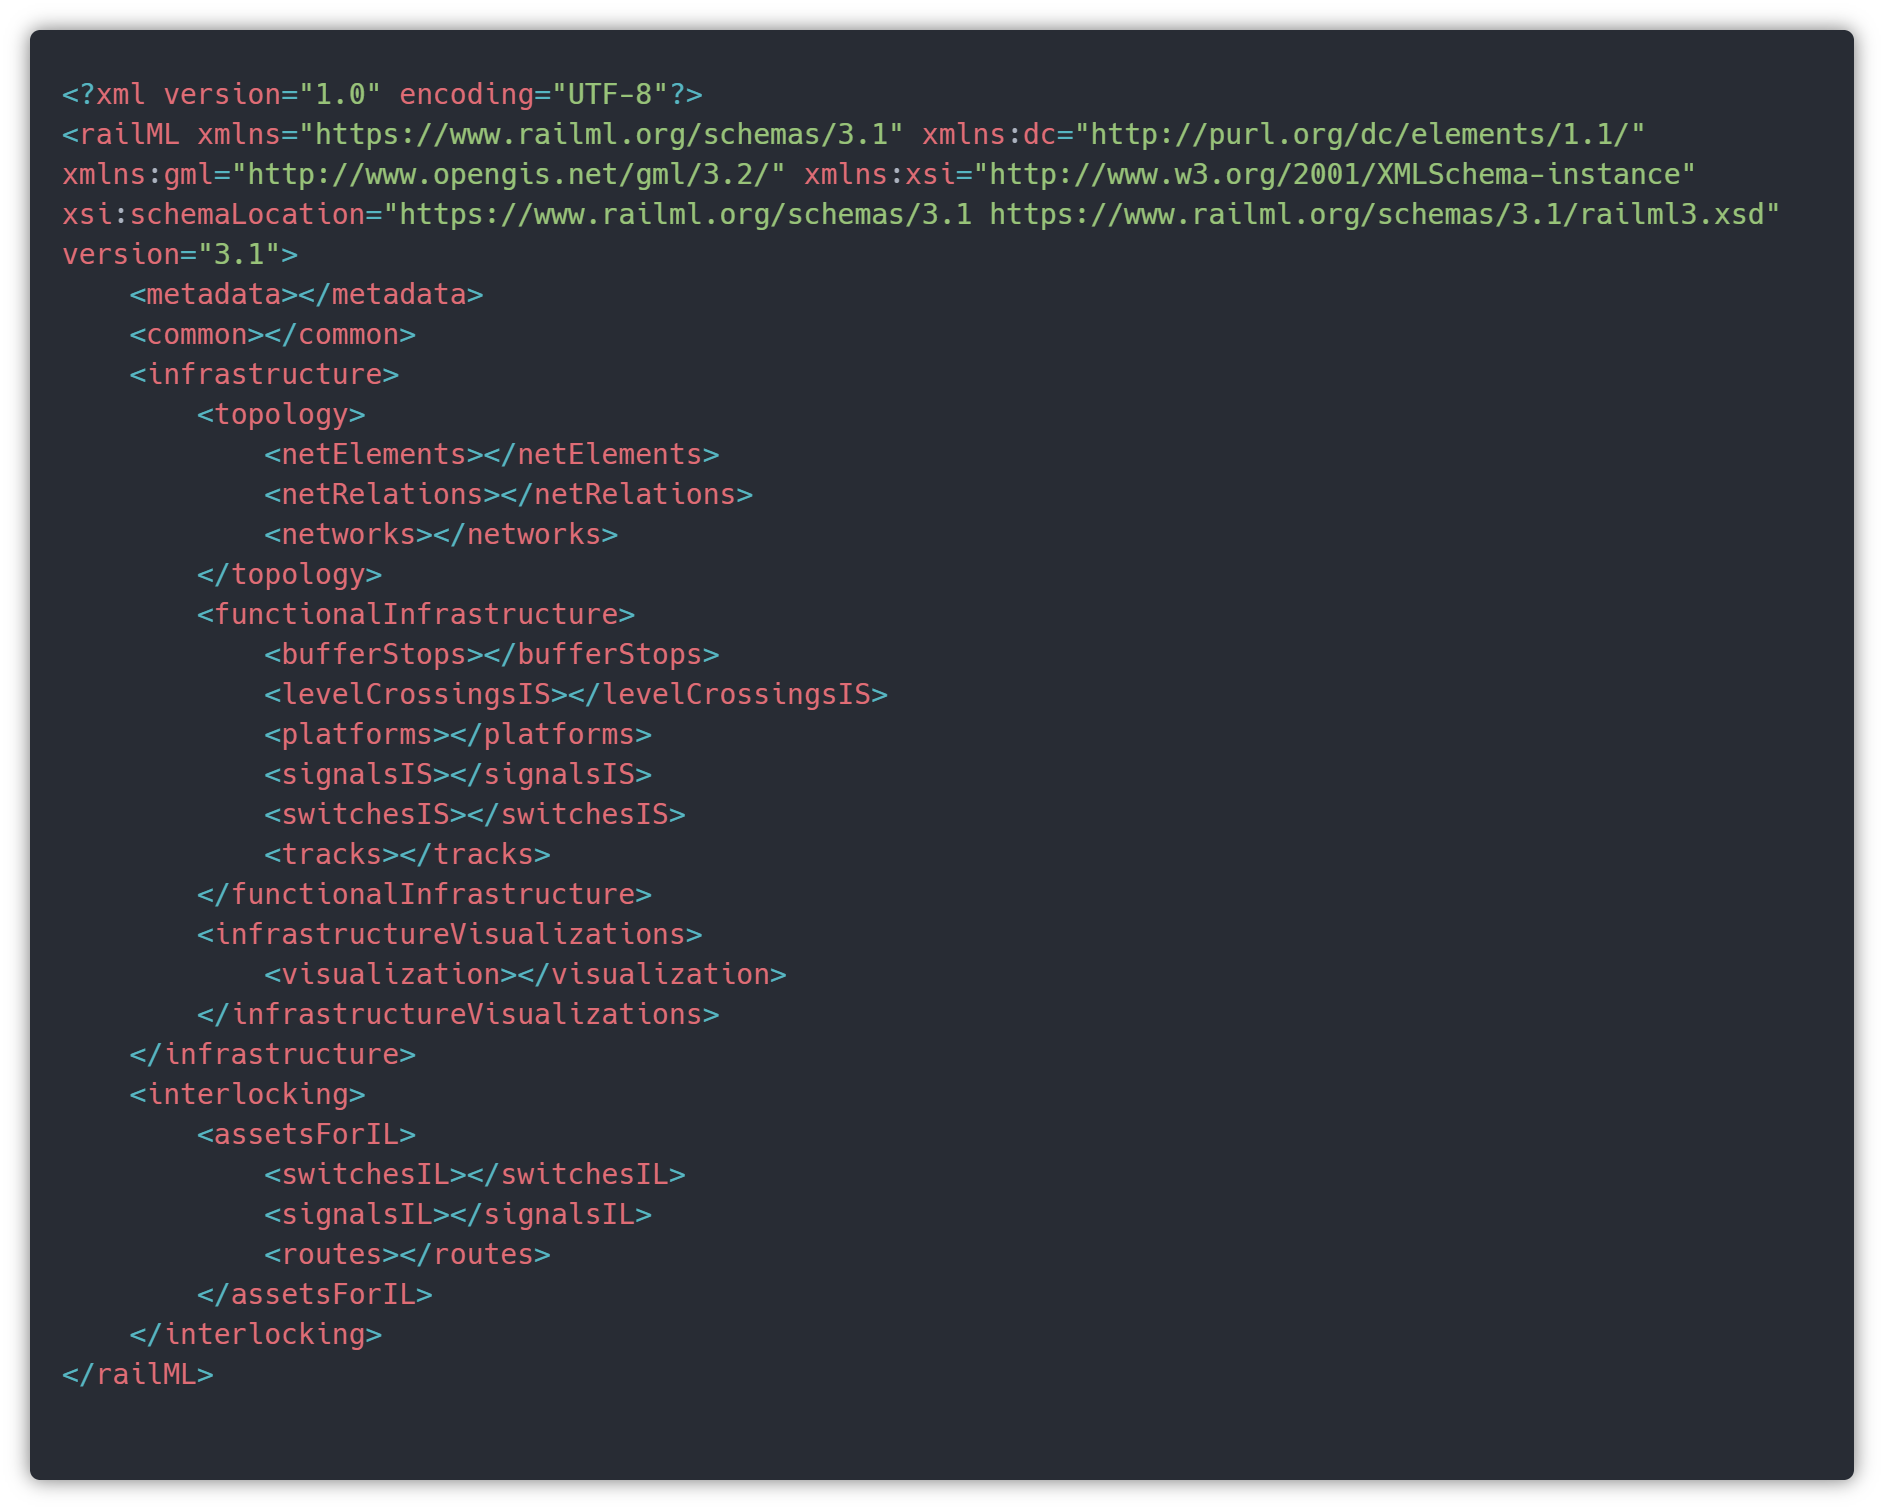
Here is an example of a railML structure that we will explore below in this article. It’s only a very very simple main structure example but for now it’s enough to have an idea of where information is extracted from the file to build a synoptic.
3. Challenges
3.1. Data Modeling Pain Points
One of the main challenges is the inherent complexity of the railML data model. Even though very complete, the depth of XML nesting and the number of interconnected elements make it difficult to extract only what is needed for visualization.
Understanding and interpreting the data is quite difficult at the beginning. Could be as simple as getting the coordinates of a signal, to extract the size and position of a section on top of a track.
Also, each project, like the one we have been working on in the last couple of years, has its own specificities, like for instance, redefinition of a size of each part of a track, or the capability of repositioning each object label.
All of the specificities that each client has, usually doesn’t have support on railML, and we have to extend or create a custom code to edit and read synoptics with these additional properties.
3.2. Real-Time Data Integration Challenges
RailML data is typically static, describing infrastructure as designed or built. Live synoptics, however, require continuous updates from operational systems such as interlockings, SCADA, or traffic management systems.
Mapping these real-time states to railML-defined objects is often non-trivial. Differences in identifiers, timing, and data granularity can lead to synchronization issues, delayed updates, or incorrect visualization of live states. You can imagine, the scale of challenges grows in proportion to the size of the network, and some of those are huge.
As network size grows, synoptics built directly from railML structures can become computationally expensive. Parsing large XML files, resolving references, and maintaining live state updates can impact performance. Rendering large or dense areas in real time may cause latency, especially in web-based clients. Without careful optimization, even small state changes can trigger costly redraw operations.
The amount of data reaching the application that manages all of this is enormous, sometimes we have to deal with hundreds of network updates each second, constantly, and that could lead us to performance issues all the time.
3.3. Visualization and UI Limitations
RailML uses a subscheme called InfrastructureVisualizations that holds, as the name said, with the infrastructure visualization, however is a little bit limited, having just some properties as coordinates, name and id to place an element like a signal in 2D or 3D visualization. Tracks possess additional properties, such as defined start and end points, or the length, etc, however, to represent and create a synoptic capable to be read, we need to edit this lines and positions of every single element and the coordinates of every single curve, to provide synoptics easy to be used on Control Centers. Remember, we are dealing with people’s lives here.
To edit this synoptics we had to build a software editor, and for that it will need a few more articles just to talk about it. Maybe the next one :).
It takes significant manual effort to achieve readable synoptics, since dense areas such as stations or yards are particularly challenging to represent clearly while preserving real-time responsiveness.
4. Practical example
As we said before, understanding all properties of railML, takes a little bit longer than just one article, but let’s explore railML, just the basics for now. We will show only how to extract data to visualize and build a simple synoptic like for example a station detail.
We will show a simple synoptic, and the result of information that we can extract from. For now let’s focus on tracks, signals, platforms and switches. This last one, will need a specific article, has very variations and properties regarding intersection availability.
This is a representation of what we can get regarding these 4 elements. This railML example (Synoptic – Station 1) file contains 4 tracks, 4 signals, 2 platforms and 2 switches.
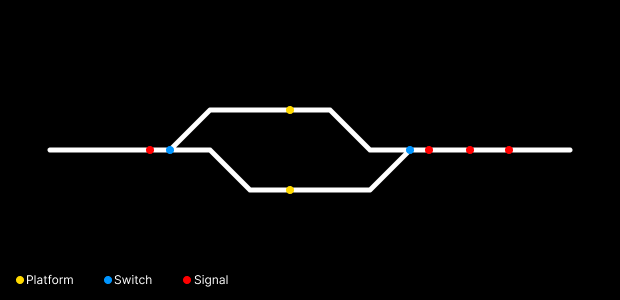
For now it’s just tracks and points on specific coordinates.
Actually it’s almost all what railML can give us about these elements, regarding visualization.
Let’s understand where this information is in the file.
Before explaining, we need to understand a few things regarding railML.
- coordinates in the railML file works like SVG coordinates, so 0,0 coordinates are on the top left corner and the positive values of them are:
- X – left to right
- Y – top to bottom
- Tag functionalInfrastructure represents data in the real world, like gps coordinates or position on track;
- Tag infrastructureVisualizations represents data in 2D/3D software world, like x and y position on a screen;
- Ids on railML has always a prefix like trk for tracks, or ne for netElements, preceded by a number em they are unique;
- In order to draw something on screen, we could use SVG in a web application for instance;
- railML only contains data, so we have to build an application to transform this information into readable interfaces.

Tracks

We have 4 tracks in this example: Track 1 (trk1), Track 2 (trk2), Track 3 (trk3) and Track 4 (trk4).
Even tracks have track id, the relation between the other elements are made via netElement ids. Tracks list are inside the <visualization> tag as children of it.
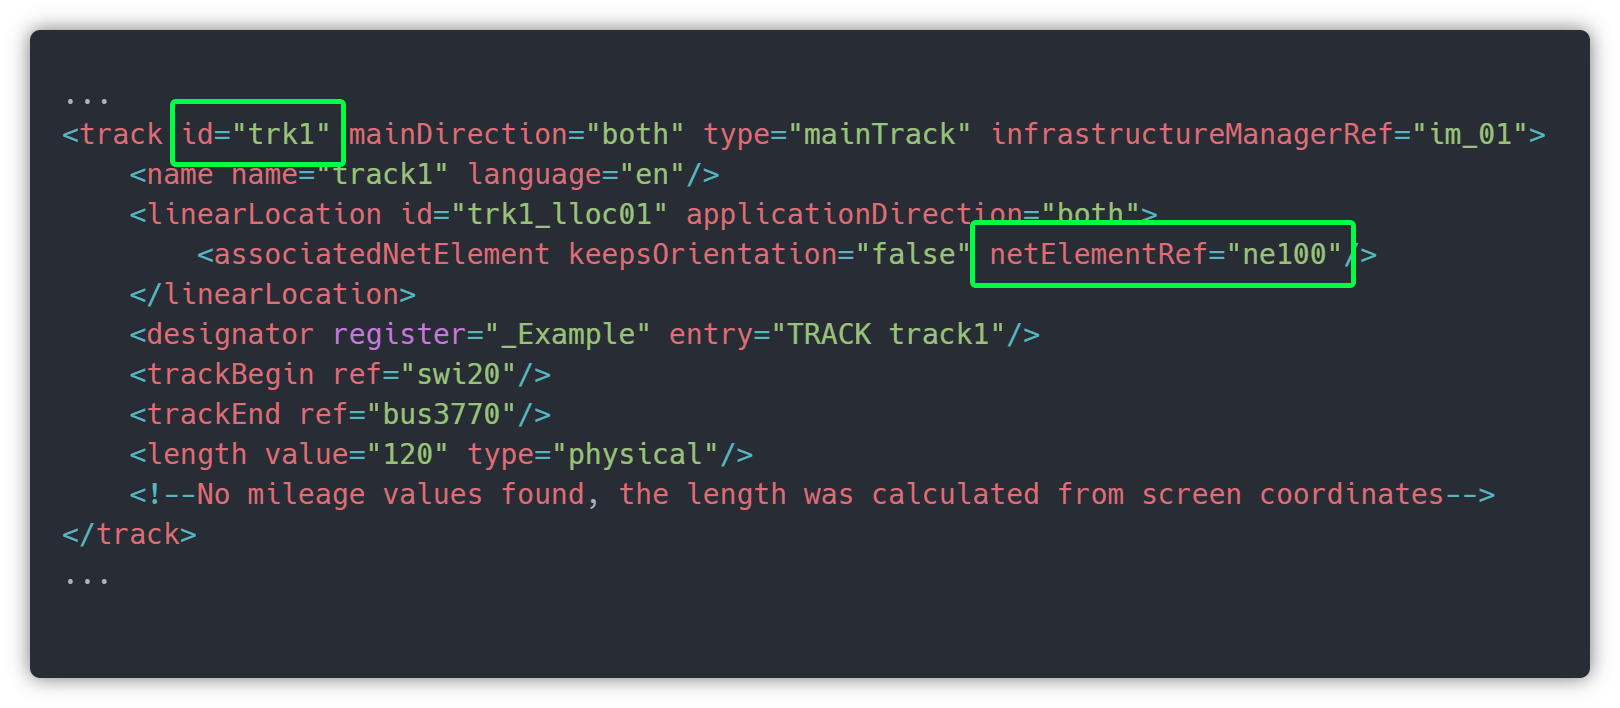
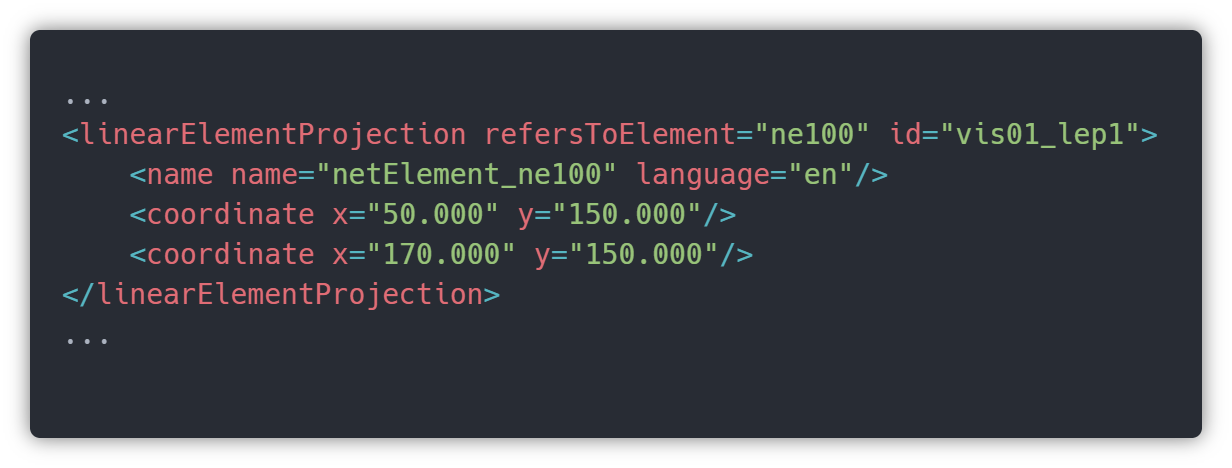
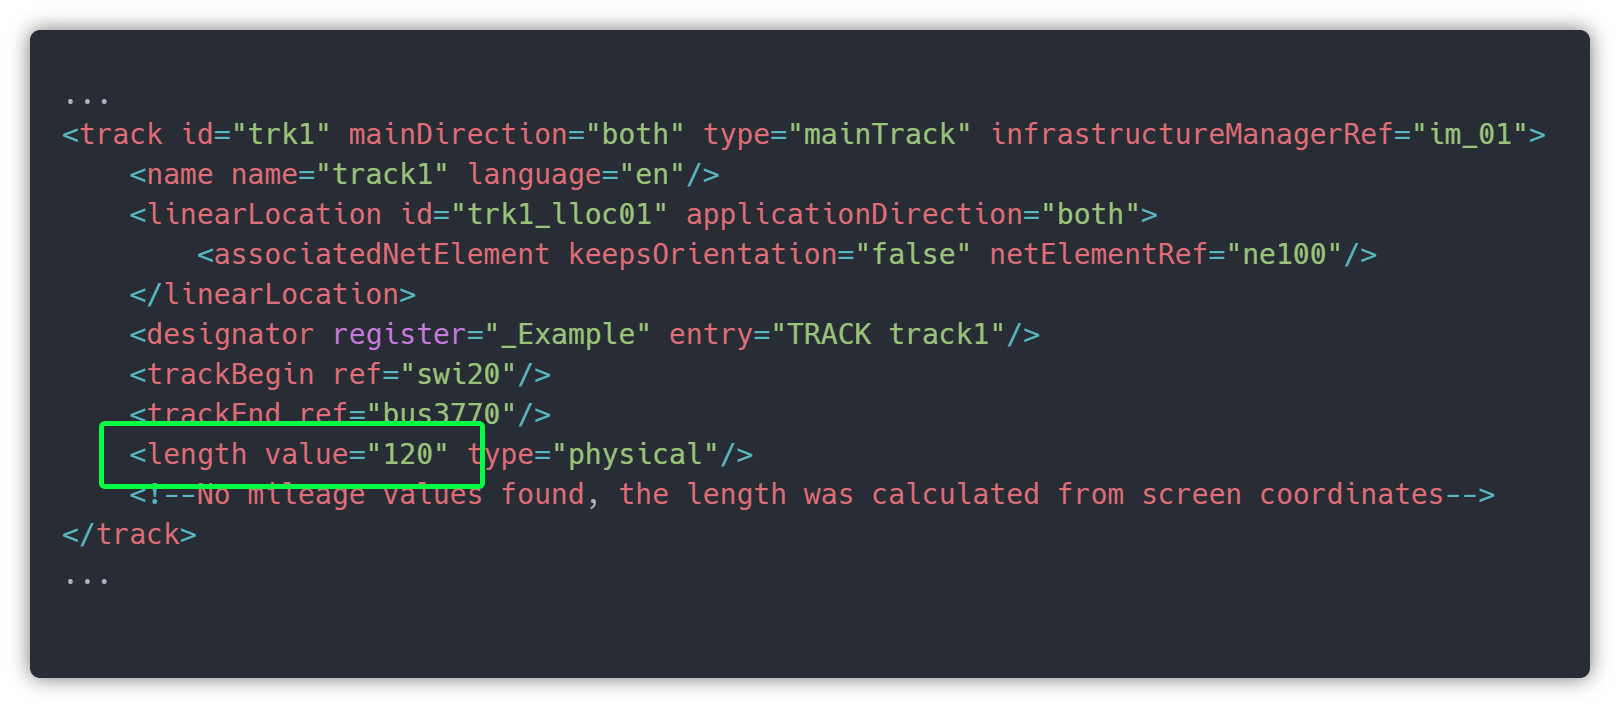
This xml code represents the trk1.
The most important attribute is netElementRef, since it is connecting trk1 to ne100, so they are the same.
In order to produce live data after we build and draw the synoptic, we will need some of these tags/attributes, like trackBegin, trackEnd, keepsOrientation. These values will allow us to position vehicles on top of these tracks and make them move when a new live date comes. But for now, let’s focus on drawing lines (tracks), and for that, we need to find on the file information to draw itRemember the infrastructureVisualizations, where the 2D world data are, so that’s it. Since now we already know that trk1 is ne100, we need to get that from tag linearElementProjection with ne100 id, and there are the coordinates to draw our line in SVG.
If SVG is not your strong suit, basically we can draw a path with those 2 pairs of coordinates, and inside an inline SVG in a HTML file it will be something like this:
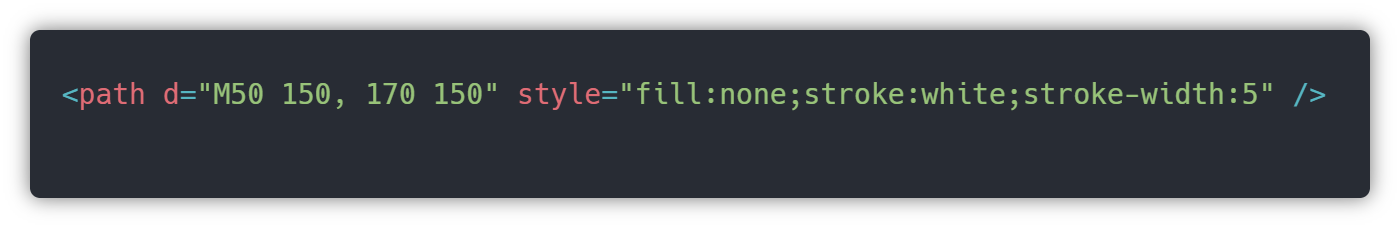
This code will draw Track 1 (trk1).
Signals and Platforms
These two, and other elements not mentioned in this article, are represented and information is obtained in the same way. The only thing that is different is the position on the railML file, signals are inside <signalsIS> tag, and platforms are inside <platforms> tag. So, in order to simplify, let’s check a signal, for instance.
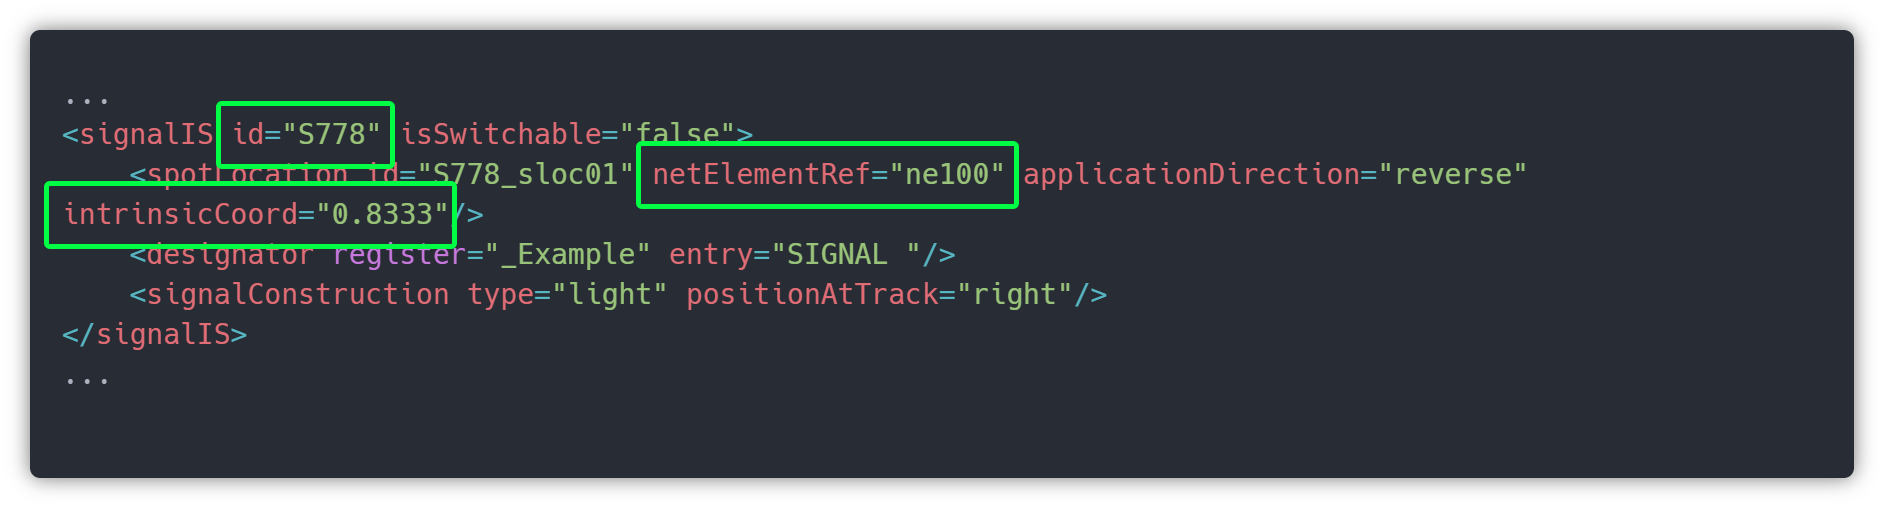
As all objects in the network, signals are referenced always to a specific netElement in a specific position in that track, so, as you can see in the image above, signal S778 is positioned on ne100 (trk1) at the 0.8333 percent (83.33%) of that track.
Another important thing to retain is positionAtTrack=”right”, which identifies that the signal should be on the right side of the track.
Note: some applications may not use this information, like the one we build, we allow the editor to customise all these attributes in order to positionate wherever it needs to be.
Once more, the position of these signals, or any other non-linear (tracks) object, is inside the <visualisation> tag, more specifically in a <spotElementProjection> tag.
The image below represents a spot projection of the S778 signal and we can extract coordinates X and Y from it.
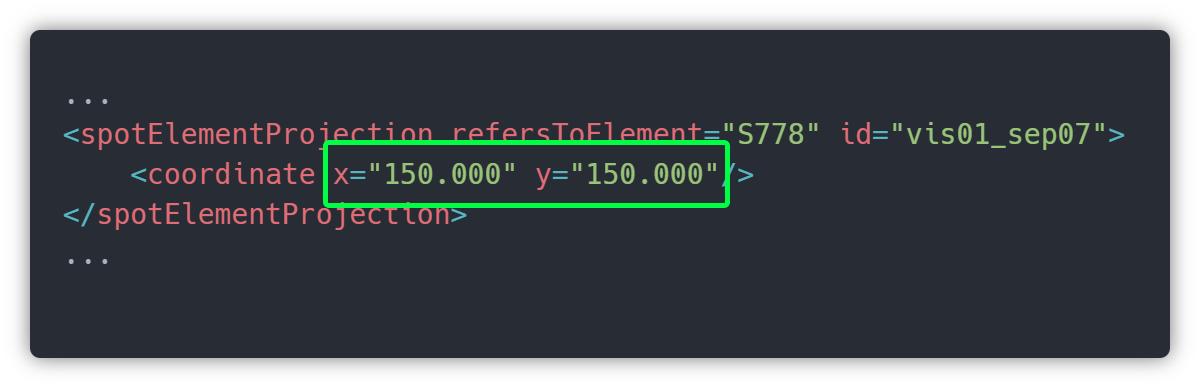
These coordinates (x=”150.000” y=”150.000 ”) were calculated automatically by an external application, but these are simple to understand. Once we get it, we no longer forget.
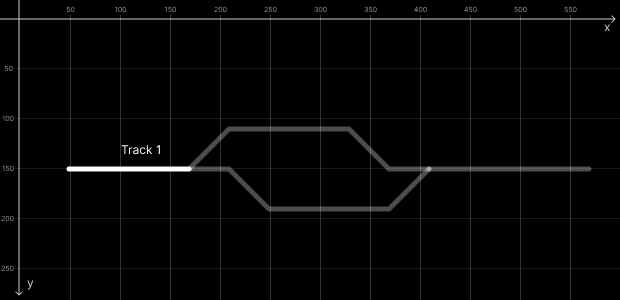
Remember that S778 is referenced on ne100 (trk1), so trk1 has 120 length, since it is horizontal (y don’t change) and it starts on coordX 50 and it ends on coordX 170. Also we can read this length value in the attributes.
So, in the image railML file – Station 1: Signal S778 identification, we check the signal is in intrinsicCoord=”0.8333”. In the image below represented with a red dot we have the positon of S778 on Track 1.
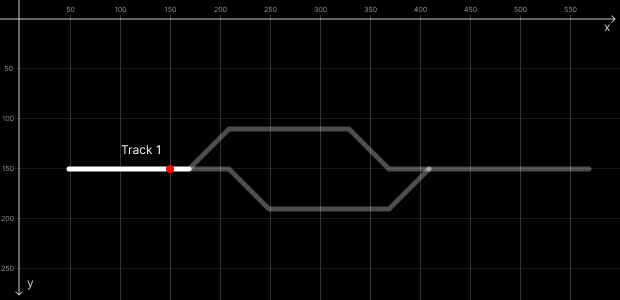
We already know the Y coordinate of this signal is 150, since Track 1 is horizontal as you can see in the image. To calculate the X coordinate we need to do a little Math, so
120 (length of track) x 0.8333 (percentage position on track) = 99.996 ≈ 100
As you can see in the image above the Track 1 starts on coordX 50, plus 100 from the position on track equals 150, that’s why S778 is on 150,150 cords.
Of course, this is a little bit complex to calculate for tracks with a lot of curves and diagonals, but don’t bother, there are plenty of plugins to help you do it.
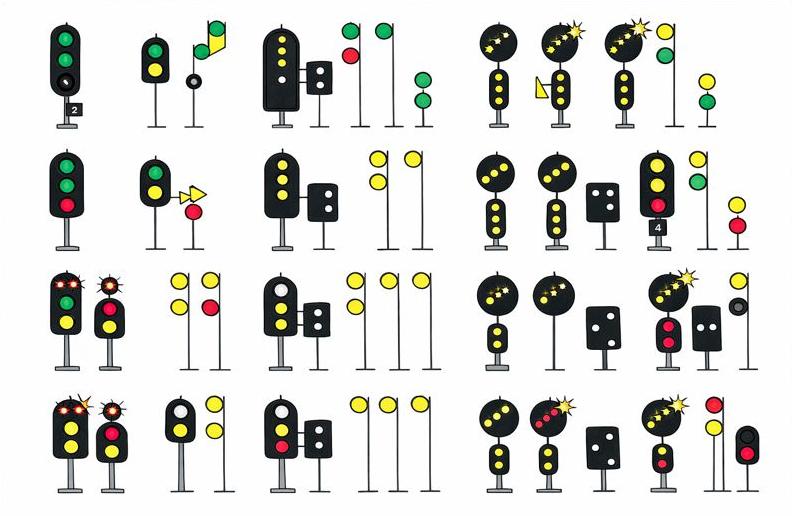
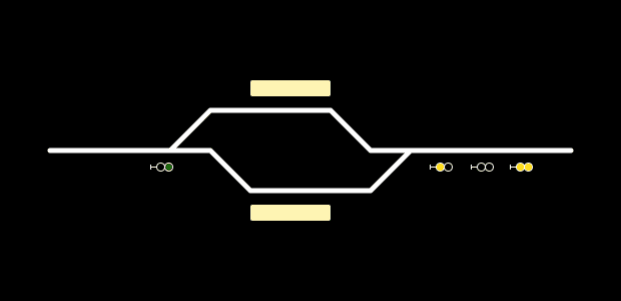
Now we reach the point where we really need an app to draw objects. For now, we just know where the signals and objects are relative to the tracks, but we need to add some UI on these signals in order to receive live data. Signals, for instance, will receive data like if the line ahead is clear or which way points are set, etc.
From here railML couldn’t help anymore, and we need to create a UI taking care of country rules or client specifications. Here are a few examples of divergent UIs.
A very simple example of visualization could be something like this. Now with some “magic” we can change the states of these signals or platforms when live data comes.
Conclusion: From Blueprint to Live Visualization
The journey to build live synoptic systems using RailML, while challenging, is highly rewarding. RailML provides a robust, standardized foundation for defining complex railway infrastructure and topology. This inherent structure, however, is merely the blueprint, not the final visual product.
As explored, key pain points arise from the need to Manage complexity and performance, and bridge the gap between logical data and visual representation, railML’s only focus on static blueprint visualization details.
Ultimately, constructing a powerful, user-friendly live synoptic relies on leveraging RailML’s comprehensive data model for the foundational infrastructure, and developing specialized, performance-optimized applications to handle the unique demands of real-time visualization and custom user experience.